
Deep Dive: Structure Chart
The interactive Structure Chart is created automatically as soon as the first company is established in Fides. The intelligent Structure Chart automatically adapts to subsequent changes and updates itself accordingly. It visualises all affiliated entities, their contractual relationships and percentage of share; also going up to shareholder level and the ultimate beneficial owners of the company.
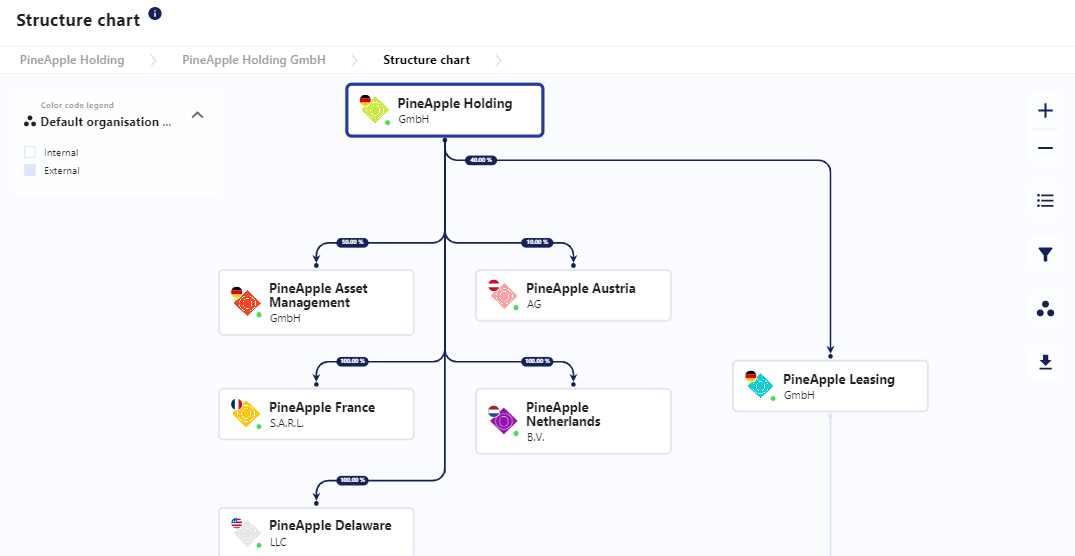
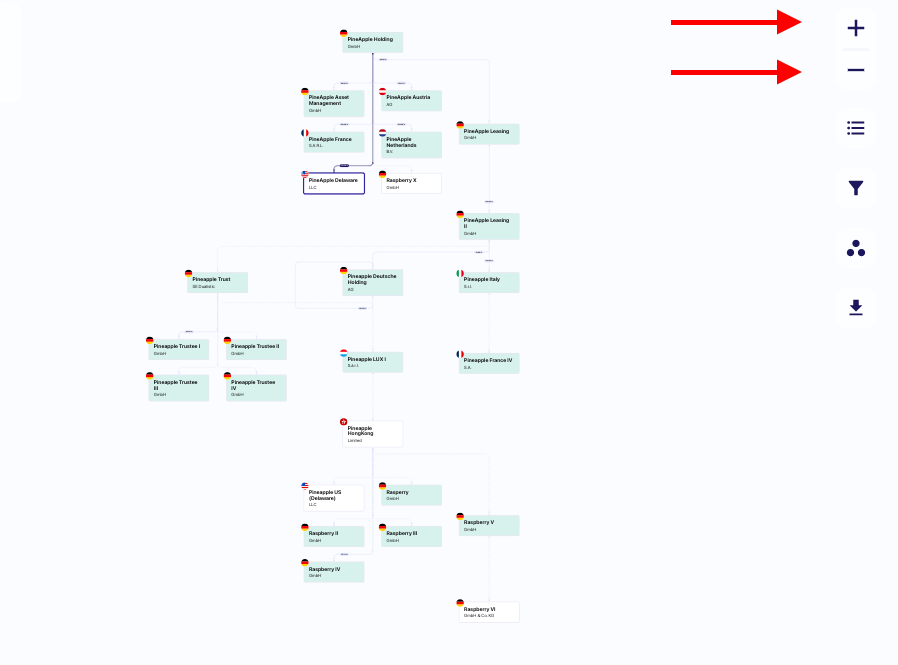
The Zoom in

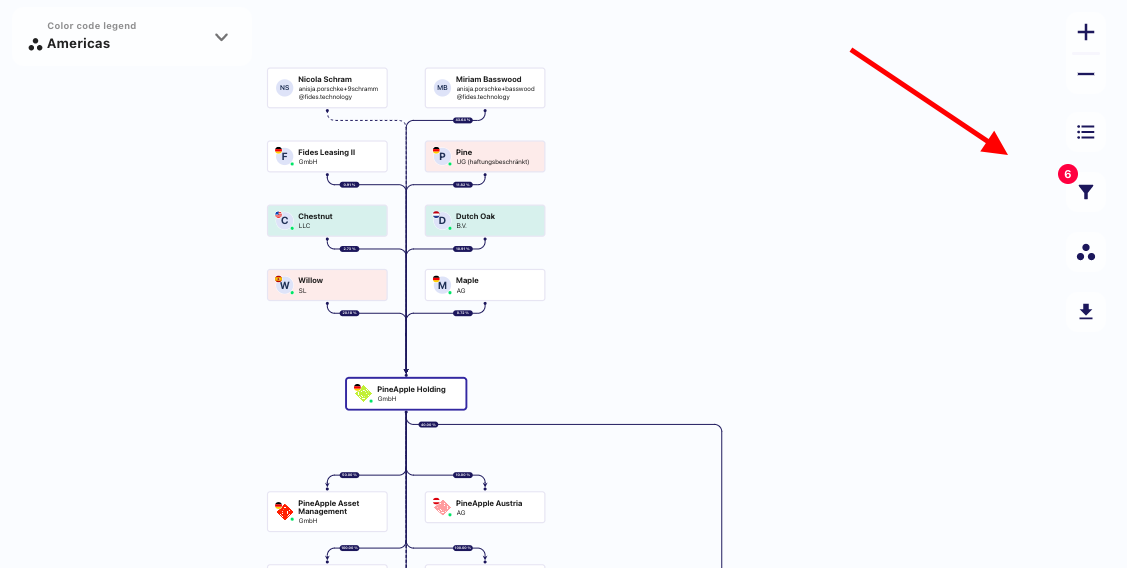
The Structure Chart provides several filter functions through the menu bar on the right side. You can choose to view only upward or downward connections, or only external shareholders and investments, or specific entities from selected jurisdictions. Additionally, you can filter all connection types based on the exact percentage of participation, as shown below.
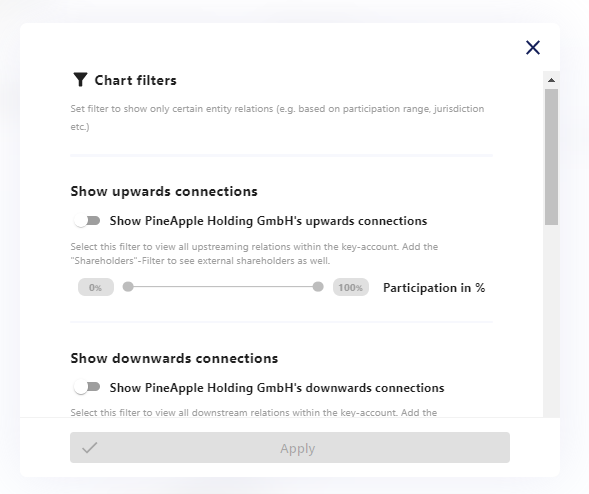
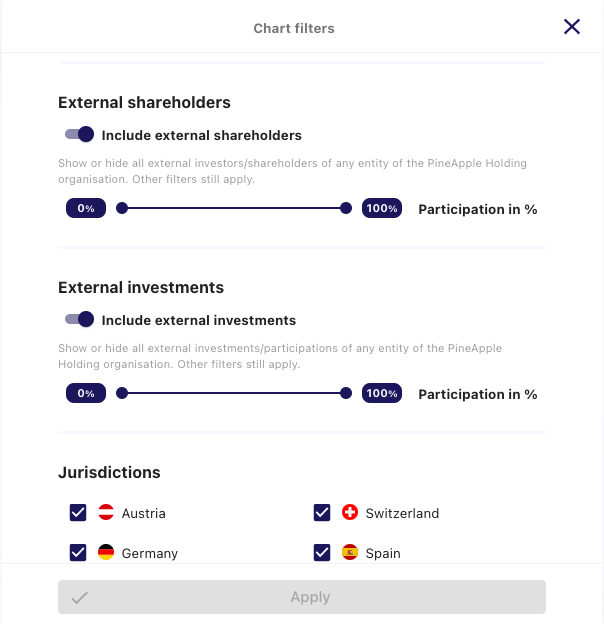
The structure chart can display all or only some of the connections based on the filters you use. You can see whether you have used any filters and how many by checking the Filter button in the menu bar on the right side
While the filter function 
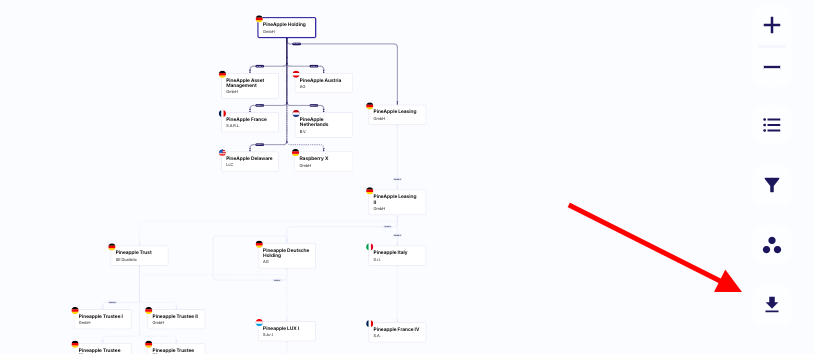
It is then possible to export the respective view as a PDF file.
Related questions:
How do I use the Filter Function in the Structure Chart?
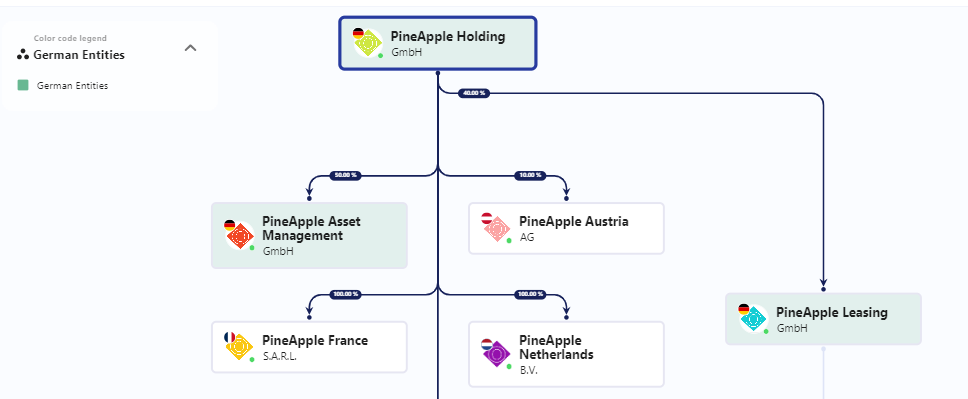
How do I use the color coding function in the Structure Chart?